Benchmark inside the SmoothWizard app
A PC benchmark for gamers.
RAM, CPU, 3D graphics and the browser in about 5 minutes. You get three point scores, overall, gaming and tasks, and the arenas show what really limits FPS on your PC. The benchmark changes nothing on your system.
- Digitally signed
- Checked before every test
- No system changes
- Remove it in one click
- 3D graphics 2,611
- CPU 1 thread 1,016
- CPU all threads 1,093
- RAM 1,035
A sample result from the scoring guide. 1000 points in a part is the level of the reference PC.
Quick benchmark · about 5 min
What exactly we measure.
Every part gets its own points. The order is fixed: RAM first, because it heats the least, graphics last, because it takes the longest. Every part has a warm-up that does not count towards the score.
RAM
Memory read, write, copy and latency. This is where XMP / EXPO, the number of sticks and timings show up.
Processor
Four workloads like in real programs and games: compression, encryption, game physics and sorting. First on 1 thread, then on all of them.
3D graphics
A full screen game scene with an FPS overlay plus compute work on the card. We measure average FPS and smoothness, the 1% low.
Browser
Scrolling and JavaScript on a real page. It counts towards the tasks score, because that is what everyday PC work looks like.
CPU in game
A game world simulation on 16, 48 and 128 MB of data, on 1 and 8 threads. It shows how much a large CPU cache helps, for example on Ryzen X3D.
CPU arena, 30 s
A 5v5 tactical map at 1280 × 720. When the graphics card is the limit, the arena does not count and the report says so.
Next to the result you also see what limits your PC the most and whether the CPU or the graphics card slowed down because of temperature or a power limit. Single tests (CPU, RAM or graphics) take 30 s to 2 min and help when you check one change.
Points
Three scores, open weights.
Every part gets points against a reference PC: 1000 points is its level, 2000 points is twice as fast. The weights are public, in the app on the “How we score” screen. Changing the weights means a new test suite and a separate ranking board.
E-sport gaming harmonic
- CPU arena 0.40
- CPU in game 0.30
- CPU 1 thread 0.15
- 3D graphics 0.10
- RAM latency 0.05
High FPS, where the processor and its cache are the limit. Without an arena result, the other parts are used.
AAA gaming harmonic
- 3D graphics 0.75
- CPU in game 0.15
- CPU 1 thread 0.05
- RAM latency 0.05
High-end graphics, where the card is the limit. A harmonic mean, because in a game the weakest part limits everything.
Tasks geometric
- CPU all threads 0.40
- CPU 1 thread 0.25
- Browser 0.20
- RAM 0.15
Like Geekbench sections: twice as good in one part always gives the same percentage gain overall.
The gaming weights apply to test suite 2.0 (benchmark 0.1.1). Scoring is still provisional while calibration runs, so results are compared only within one test suite.
Arenas
Game-like scenes, loop after loop.
Arenas are full screen scenes. Every loop is exactly the same, so you can compare FPS and 1% low from full loops before and after a settings change. Before measuring, the world builds up from above, the camera drops to the start, and measuring begins only once frame times are even.
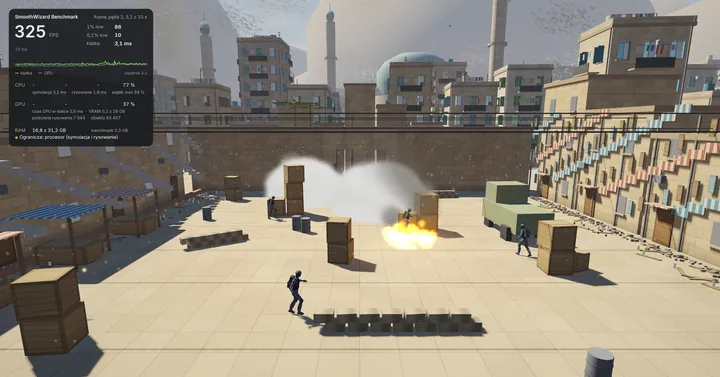
CPU arena · Direct3D 11
A tactical shooter, limited by the CPU
Our own map: a square with houses, market stalls and a truck, surrounded by a town and flocks of birds. 5v5 bots, smokes, molotovs, flashbangs and grenades. Every frame the whole world is simulated like in a game, on 7 threads, in parallel with rendering.
- Bots see through rays cast past cover and smoke, about 180 thousand town objects, 8192 birds.
- About 67 MB of data with scattered access: it fits in the 96 MB L3 of X3D processors, not in 32-36 MB.
- CPU arena 2 “Assault”: an old town and a round with a charge, the camera follows the action.
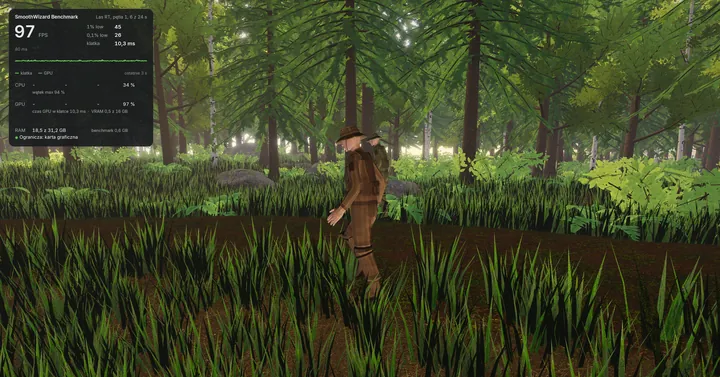
GPU arena · Direct3D 12
A ray traced forest, limited by the GPU
Hills, a path and a pond, spruces with needles, oaks and birches with thousands of leaves, ferns, grass in the wind. A stag, does, a fox and foresters with skeletons and animation. The camera flies through the forest in a 24 s loop.
- DXR 1.1 ray tracing (RayQuery): sun shadows and ambient occlusion at 1 ray per pixel, reflections in the pond. Alpha-cut leaves and needles are in the rays too.
- Character skinning on the GPU, ray tracing structures rebuilt every frame, LOD in 20 m squares, MSAA with alpha-to-coverage, HDR with bloom.
- Needs a DXR 1.1 card: GeForce RTX 20, Radeon RX 6000, Intel Arc and newer. No points, because ray tracing performs very differently across vendors.
How to use it
Change one thing. See what it gave you.
- Run the quick benchmarkClose games and heavy programs. Do not click or move the mouse during the test. Esc stops it at any time.
- See what limits youThe result names the weakest part and tells you whether the CPU or the card slowed down because of temperature or a power limit.
- Change one thingXMP / EXPO, PBO, the driver, the power plan. Then run the test for that one part, 30 s to 2 min.
- Compare honestlyThe app compares with your previous result of that test. A difference smaller than the measurement spread is “no measurable change”, not a made-up percentage.
System latency. The benchmark also has a separate latency measurement: a software estimate in milliseconds, from an input event to the frame shown by Windows. It does not measure the mouse or the monitor and does not count towards the score.
Fair measurement
The same test for every brand.
- The same work on every PCInput data comes from a public seed, identical on every computer. A slower PC does the same chunk of work for longer, not a smaller one.
- No vendor specific pathsThe scoring code does not check the CPU or GPU brand and does not use any single vendor’s libraries. AVX-512 and ray tracing are outside the main score.
- Warm-up and medianEvery part has a warm-up outside the score, then several runs. The median goes into the points, and the spread of the runs is shown with the result.
- Temperature and power watchedWhen the CPU or the card slows down because of heat or a power limit, the result says so. Without sensor readings we do not guess and do not take points away.
- Settings saved with the resultXMP / EXPO, timings, PBO, Curve Optimizer and other settings from the time of the test. Some readings need the PawnIO driver, the same as the BIOS tab.
- ProtectionA SkullMedia digital signature and checksums checked before every test. A result made with a debugger attached or with modified files is untrusted and never reaches the ranking.
Ranking
Compare yourself with other gamers.
The ranking takes the best result of each account. In the app you search by CPU, card, memory and dies (for example 9800X3D, 4070, A-die) and instantly see how many players have the same hardware. The ranking is for signed-in users, and everyone chooses what to show.
RAM timings, XMP / EXPO, PBO and Curve Optimizer for results whose authors share them. Benchmark › Ranking › Details
- 1synpapiezaBIOSRyzen 7 9800X3D · RX 9070 XT3,180pts
- 2ElementBIOSRyzen 7 9800X3D · RTX 50703,094pts
- 3#DEB3BIOSRyzen 7 9800X3D · RTX 50802,983pts
- 4KazikBIOSRyzen 7 7800X3D · RTX 50702,724pts
- 5#133BBIOSRyzen 7 9800X3D · RTX 4070 Ti SUPER2,538pts
12 results in the ranking
Stability tests
Fast is one thing. Stable is another.
A long load with every result checked. The result is pass or fail, with no points and no ranking. Useful after overclocking, after an undervolt and when games crash at random.
CPU stress test
Big number multiplication like y-cruncher, FMA and sorting on all cores, then every core on its own. An error names the exact core.
PBO, Curve Optimizer ›RAM stress test
TestMem5 style patterns on almost all free memory. Four profiles: Standard, X3D, Intel and Extreme.
XMP, EXPO, timings ›GPU stress test
Every calculation done twice and compared bit for bit, plus a video memory test. Short chunks with no false driver resets.
GPU OC and undervolt ›Questions
FAQ
Is the benchmark free?
Yes. You download it from the Benchmark tab in SmoothWizard, Free version included. The quick benchmark, single tests, arenas and stability tests up to 1 hour work without PRO. PRO adds a stability test with no time limit.
Does the benchmark change anything on my PC?
No. It only measures. The program runs during the test and does not stay in the background. Before every test the app checks the digital signature and the checksums of the benchmark files.
How long does the quick benchmark take?
About 5 minutes: RAM, the processor on 1 thread and on all threads, a full screen game scene and a browser test. A single CPU, RAM or graphics test takes 30 seconds to 2 minutes.
What does 1000 points mean?
1000 points in any part is the level of the reference PC. 2000 points is twice as fast. The overall score is gaming plus tasks, so the reference PC has 2000 points overall.
Does ray tracing count towards the score?
No. The ray traced GPU arena is a separate graphics card test with no points. Vendors support ray tracing very differently, so counting it would favour one brand.
Who can see my result?
Your result stays on your PC. Only a complete, trusted result from a signed-in account goes to the ranking, and only with sending turned on. You choose whether to show your nick, avatar, RAM, motherboard and BIOS settings. The top of the ranking is also on smoothwizard.com, with a nick or an anonymous number, without RAM, board or BIOS.
What are the requirements?
64-bit Windows on an x64 processor and SmoothWizard 2.3.3 or newer. The GPU arena needs a DXR 1.1 card, for example GeForce RTX 20, Radeon RX 6000, Intel Arc and newer.
See what your PC really does.
You download the benchmark once, in the Benchmark tab in SmoothWizard. Results, history and the ranking live in the same tab.